

Data visualizations made human friendly
Your guide to creating impactful data visualizations
Explore more
The DataHues Academy launches in 2026.
Your gateway to mastering data design and dashboard strategy.
Built for those who want more than just technical skills or theoretical frameworks.

I want to visualize data
01
I want to design dashboards
02
I want to setup a strategy
03
Join the early bird list for priority access, exclusive resources, and cohort updates.
Data designer
specialized in Power BIHello there! I’m Mariska - I design data visualizations and dashboards that are user-friendly, modern & speak to your users.


Trusted by global teams to design
dashboarding strategies
-
Developing scalable and robust dashboarding strategies. From information architecture to UI.
2025
Simmons & Simmons (global)
Vecos
Chassé Theater
Fixed Finance
Roompot vakantieparken
2023
-
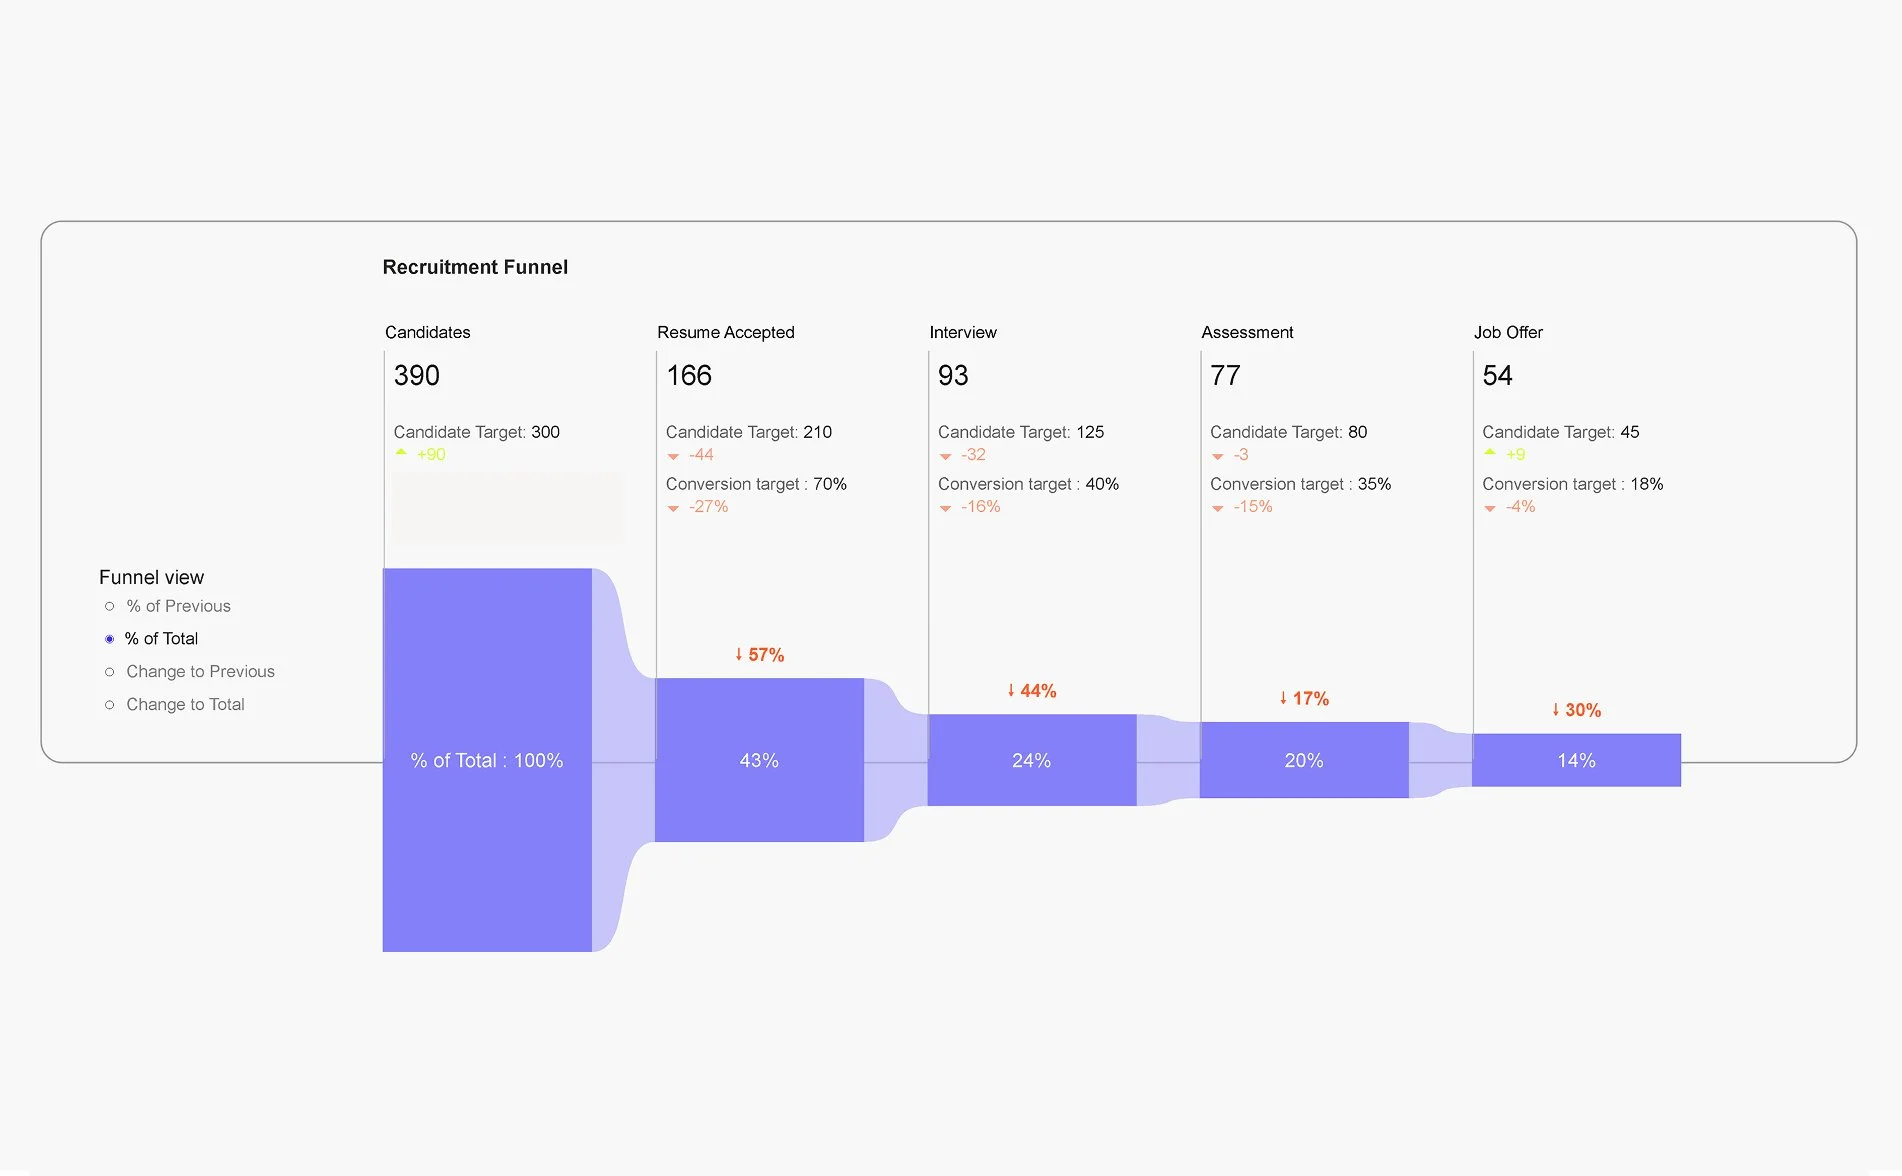
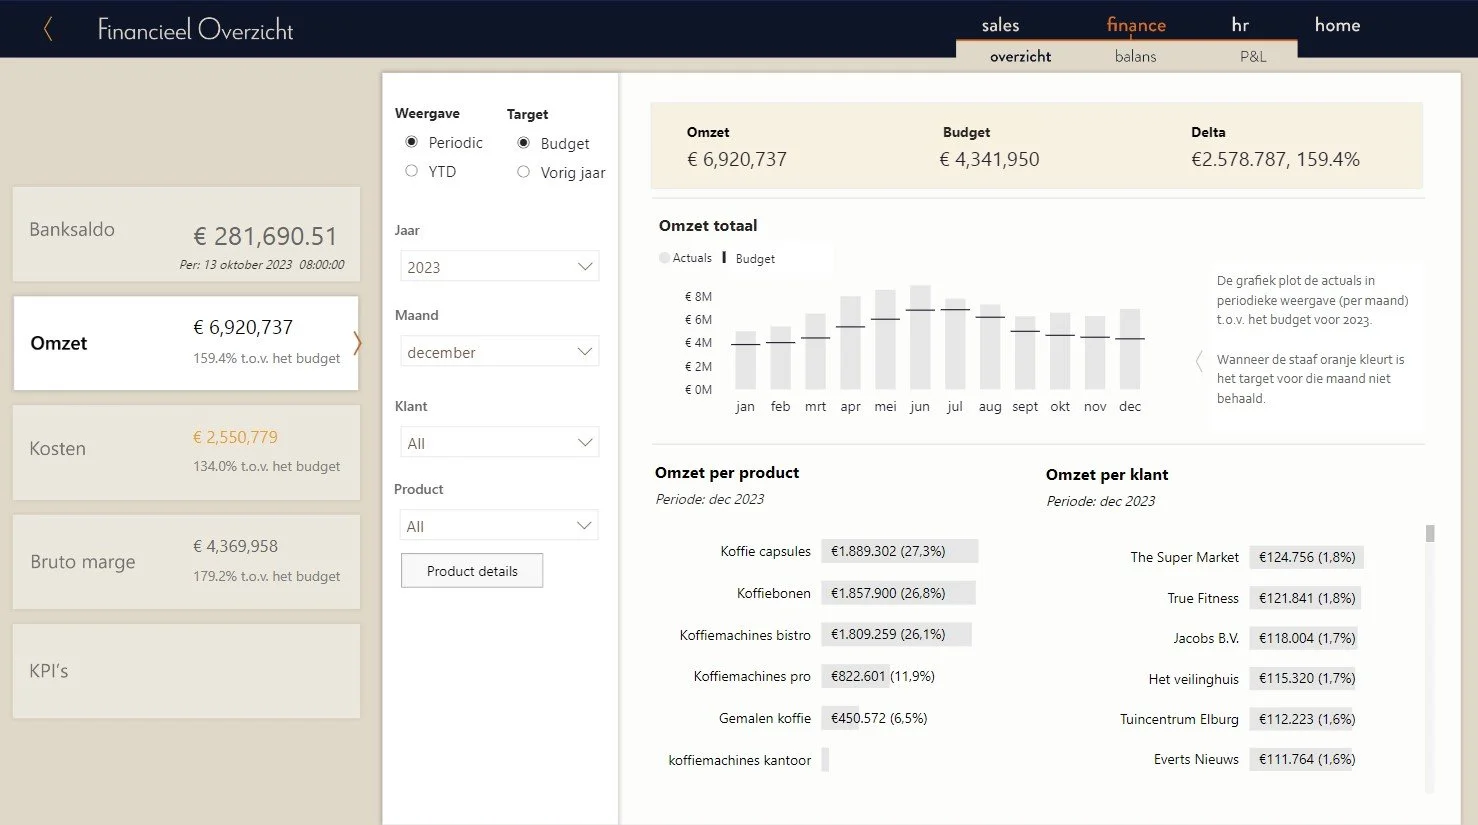
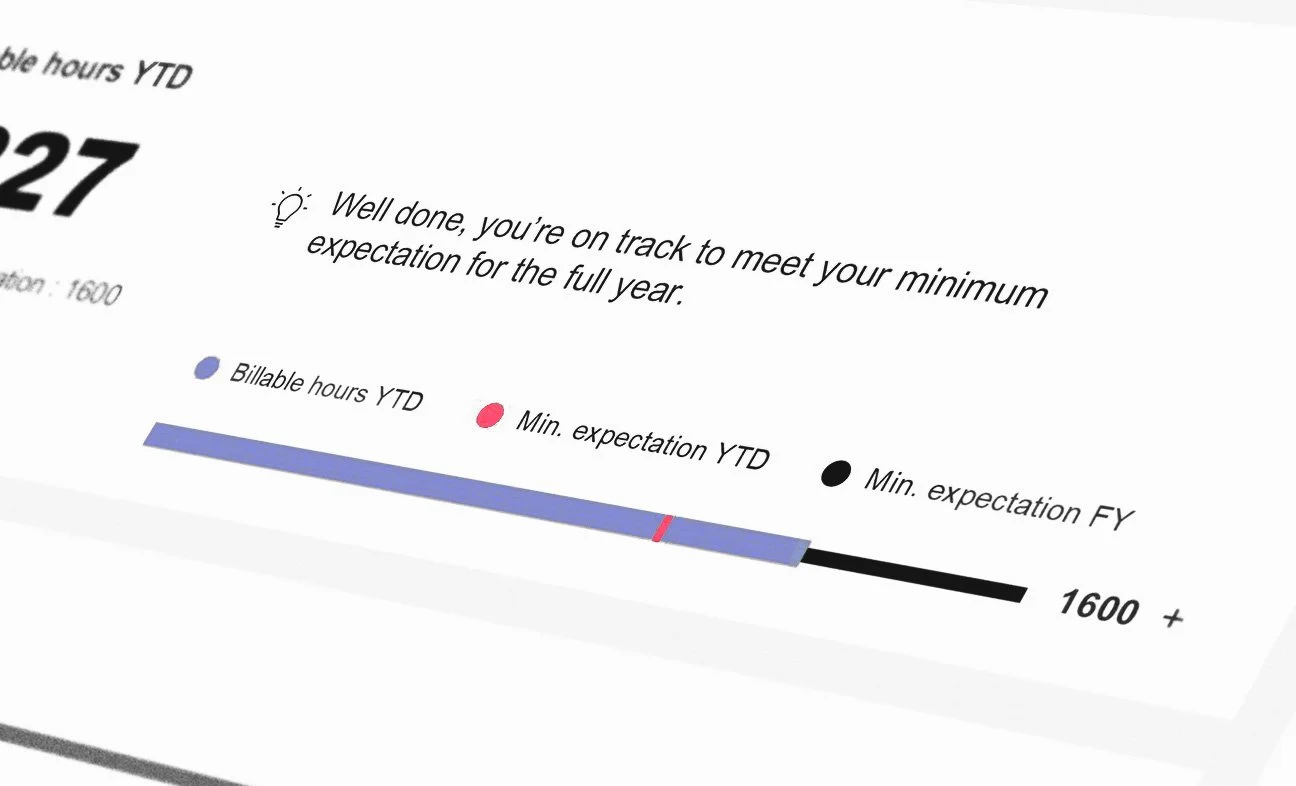
(re-)Designing visually engaging dashboards with applied UX principles.
2025Simmons & Simmons (global)
Vecos
Scheepswerf Slob
DEPT agency
Bakker Magnetics
Brownline
Fixed Finance
Kasparov Finance & BI
Smurfit Kappa
2022
-
Building and deploying Power BI dashboards.
2025
Simmons & Simmons (global)
Chassé Theater
LastMileSolutions
Smurfit Kappa
Kasparov Finance & BI
Obesitas Kliniek Nederland
Koninklijke Woudenberg
2022
-
Empowering with Power BI and dashboard design skills.
2024
Schouten & Nelissen
OK solutions
Profuomo
Appèl
Damen
DEPT Agency
Erasmus University Rotterdam
Hogeschool InHolland
Avans Hogeschool Breda
Avans Hogeschool Roosendaal
2022
Ways we can work together
-

Dashbboard Design System (NL/ENG)
-

Dashboard Audit (NL/ENG)
-

Data Design (NL/ENG)
-
Dashboard Design Training (NL/ENG)