
Data Design Tutorials
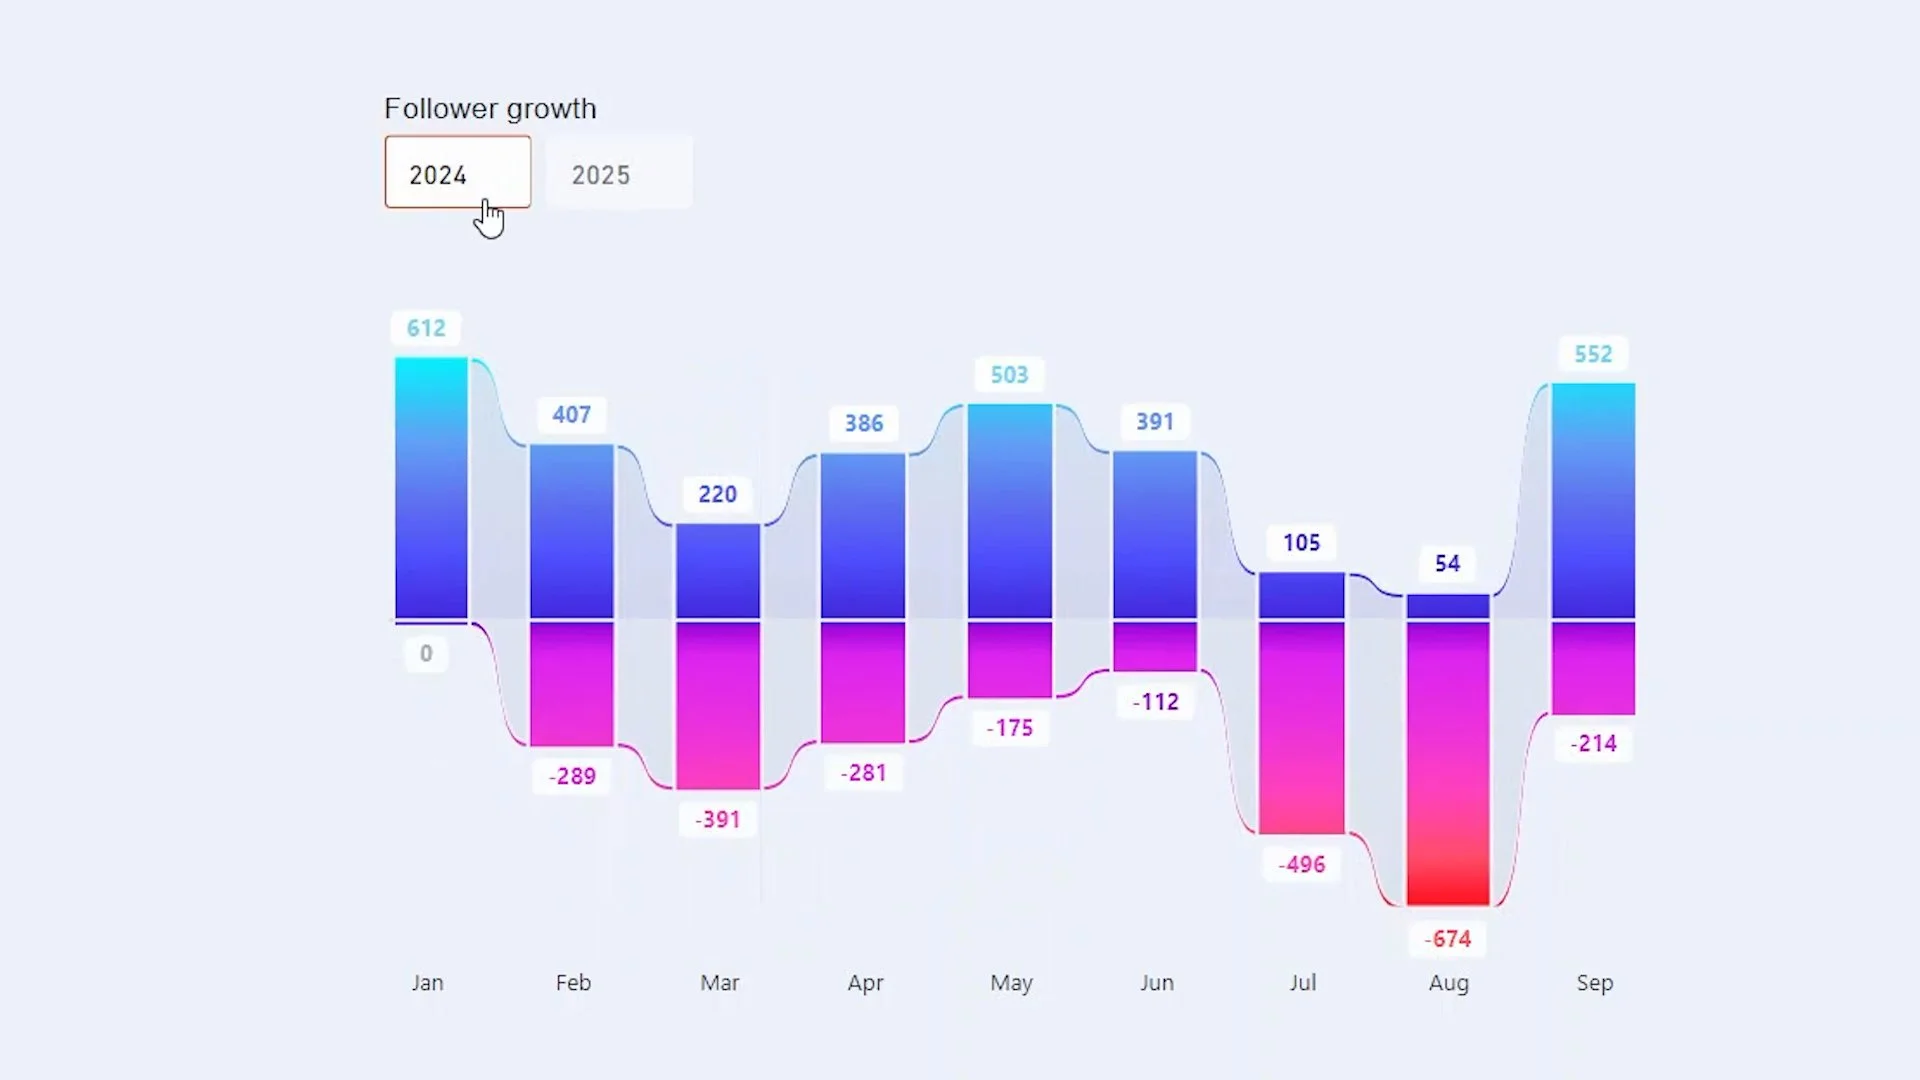
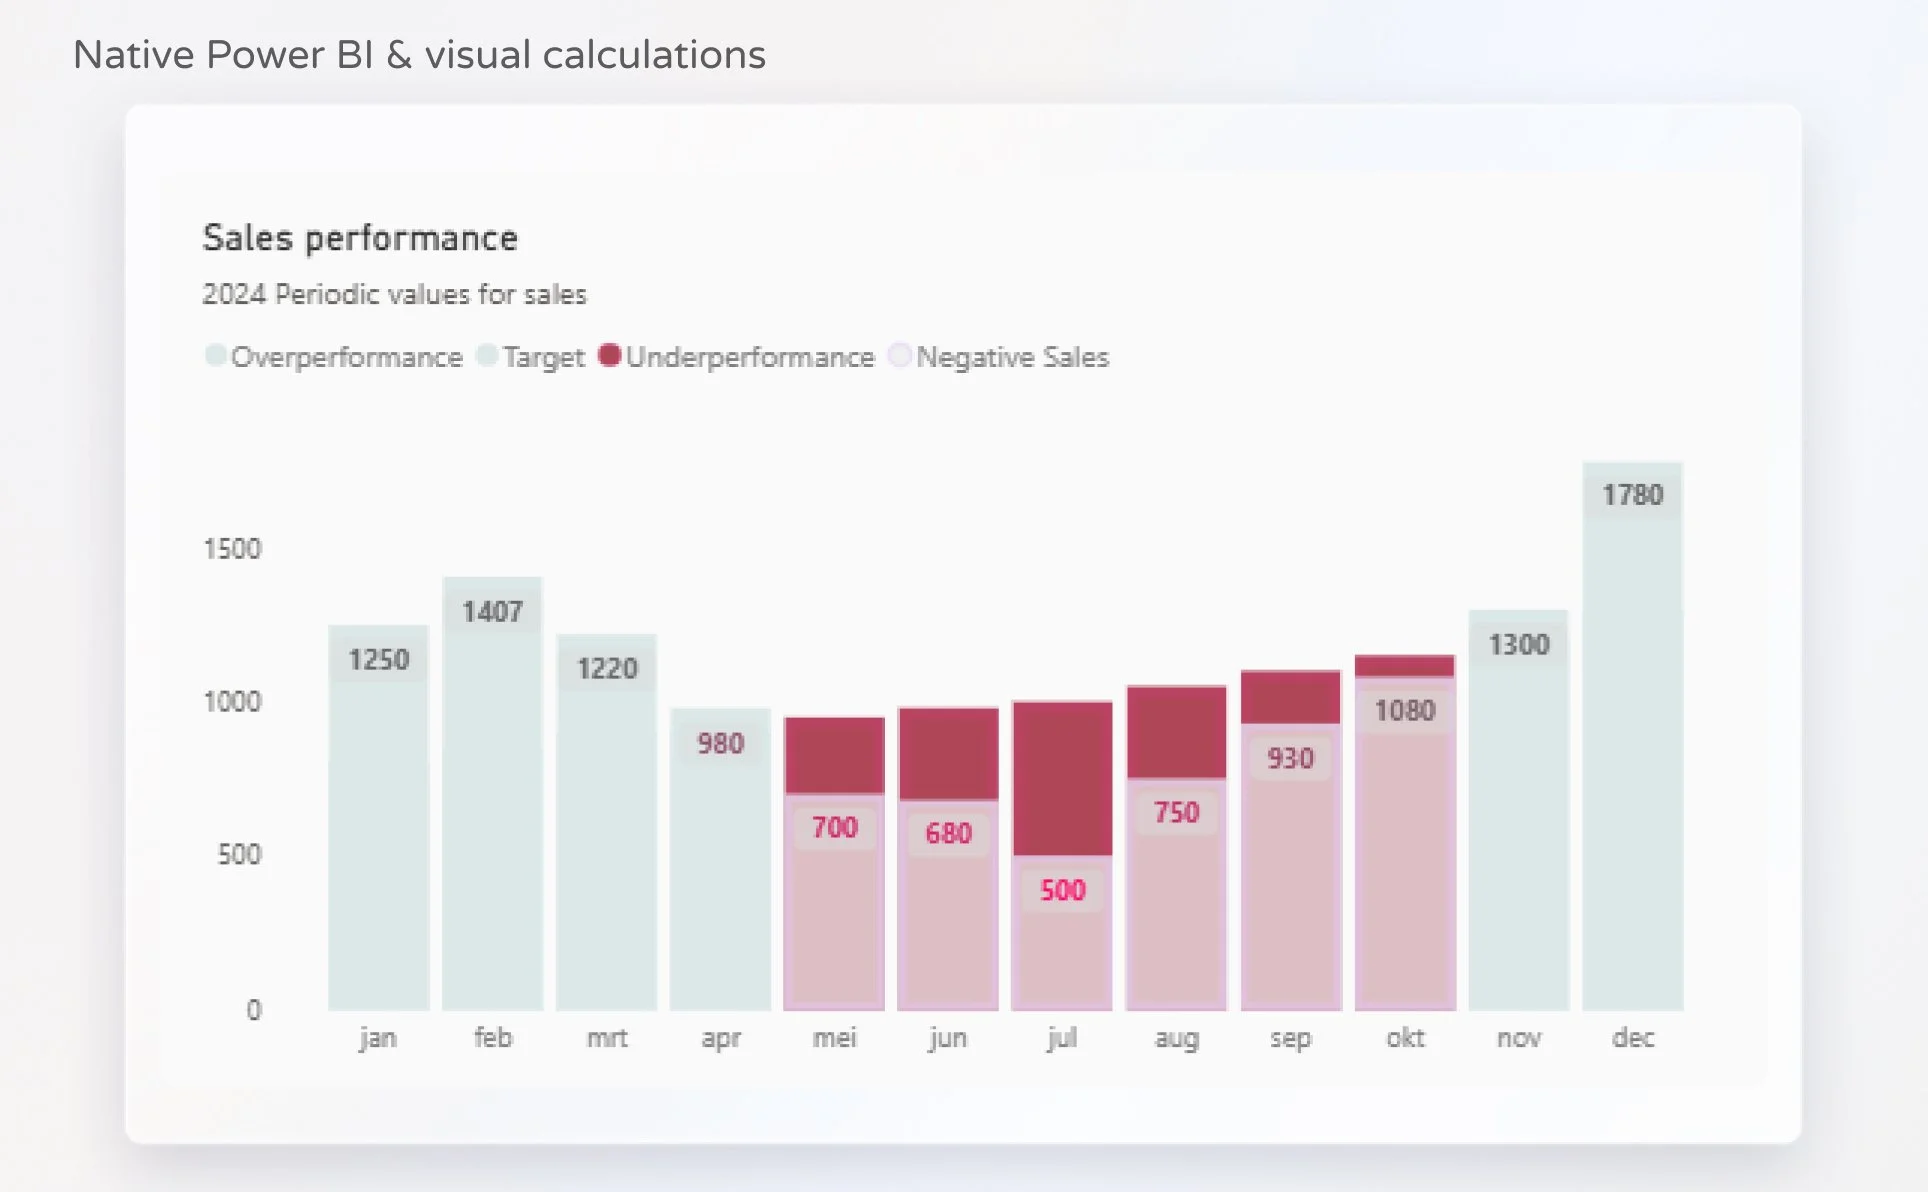
Tutorial 1: Balance Chart
Show what happened under the overall trend of growth or decline. With Power BI native visuals only.

Tutorial 2: Funnel Chart
Track the progression of a value through a series of stages. With Power BI native visuals only.

Tutorial 3: Pareto Chart
Show where key factors and priorities lie. With Power BI native visuals only.
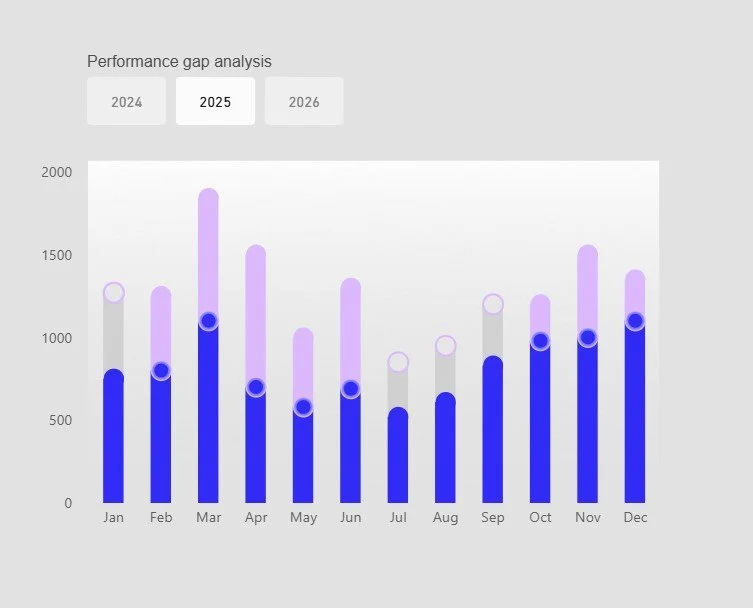
Tutorial 4: Bullet Graph
Analyse the gap between actuals and benchmarks. With Power BI native visuals and visual calculations.

Tutorial 5: Dumbbell Chart
Analyse the gap between actuals and benchmarks. With Power BI native visuals and visual calculations.
Tutorial 6: 3D Step Chart
Show the trend over time in a memorable way. With Power BI Native visuals and figma
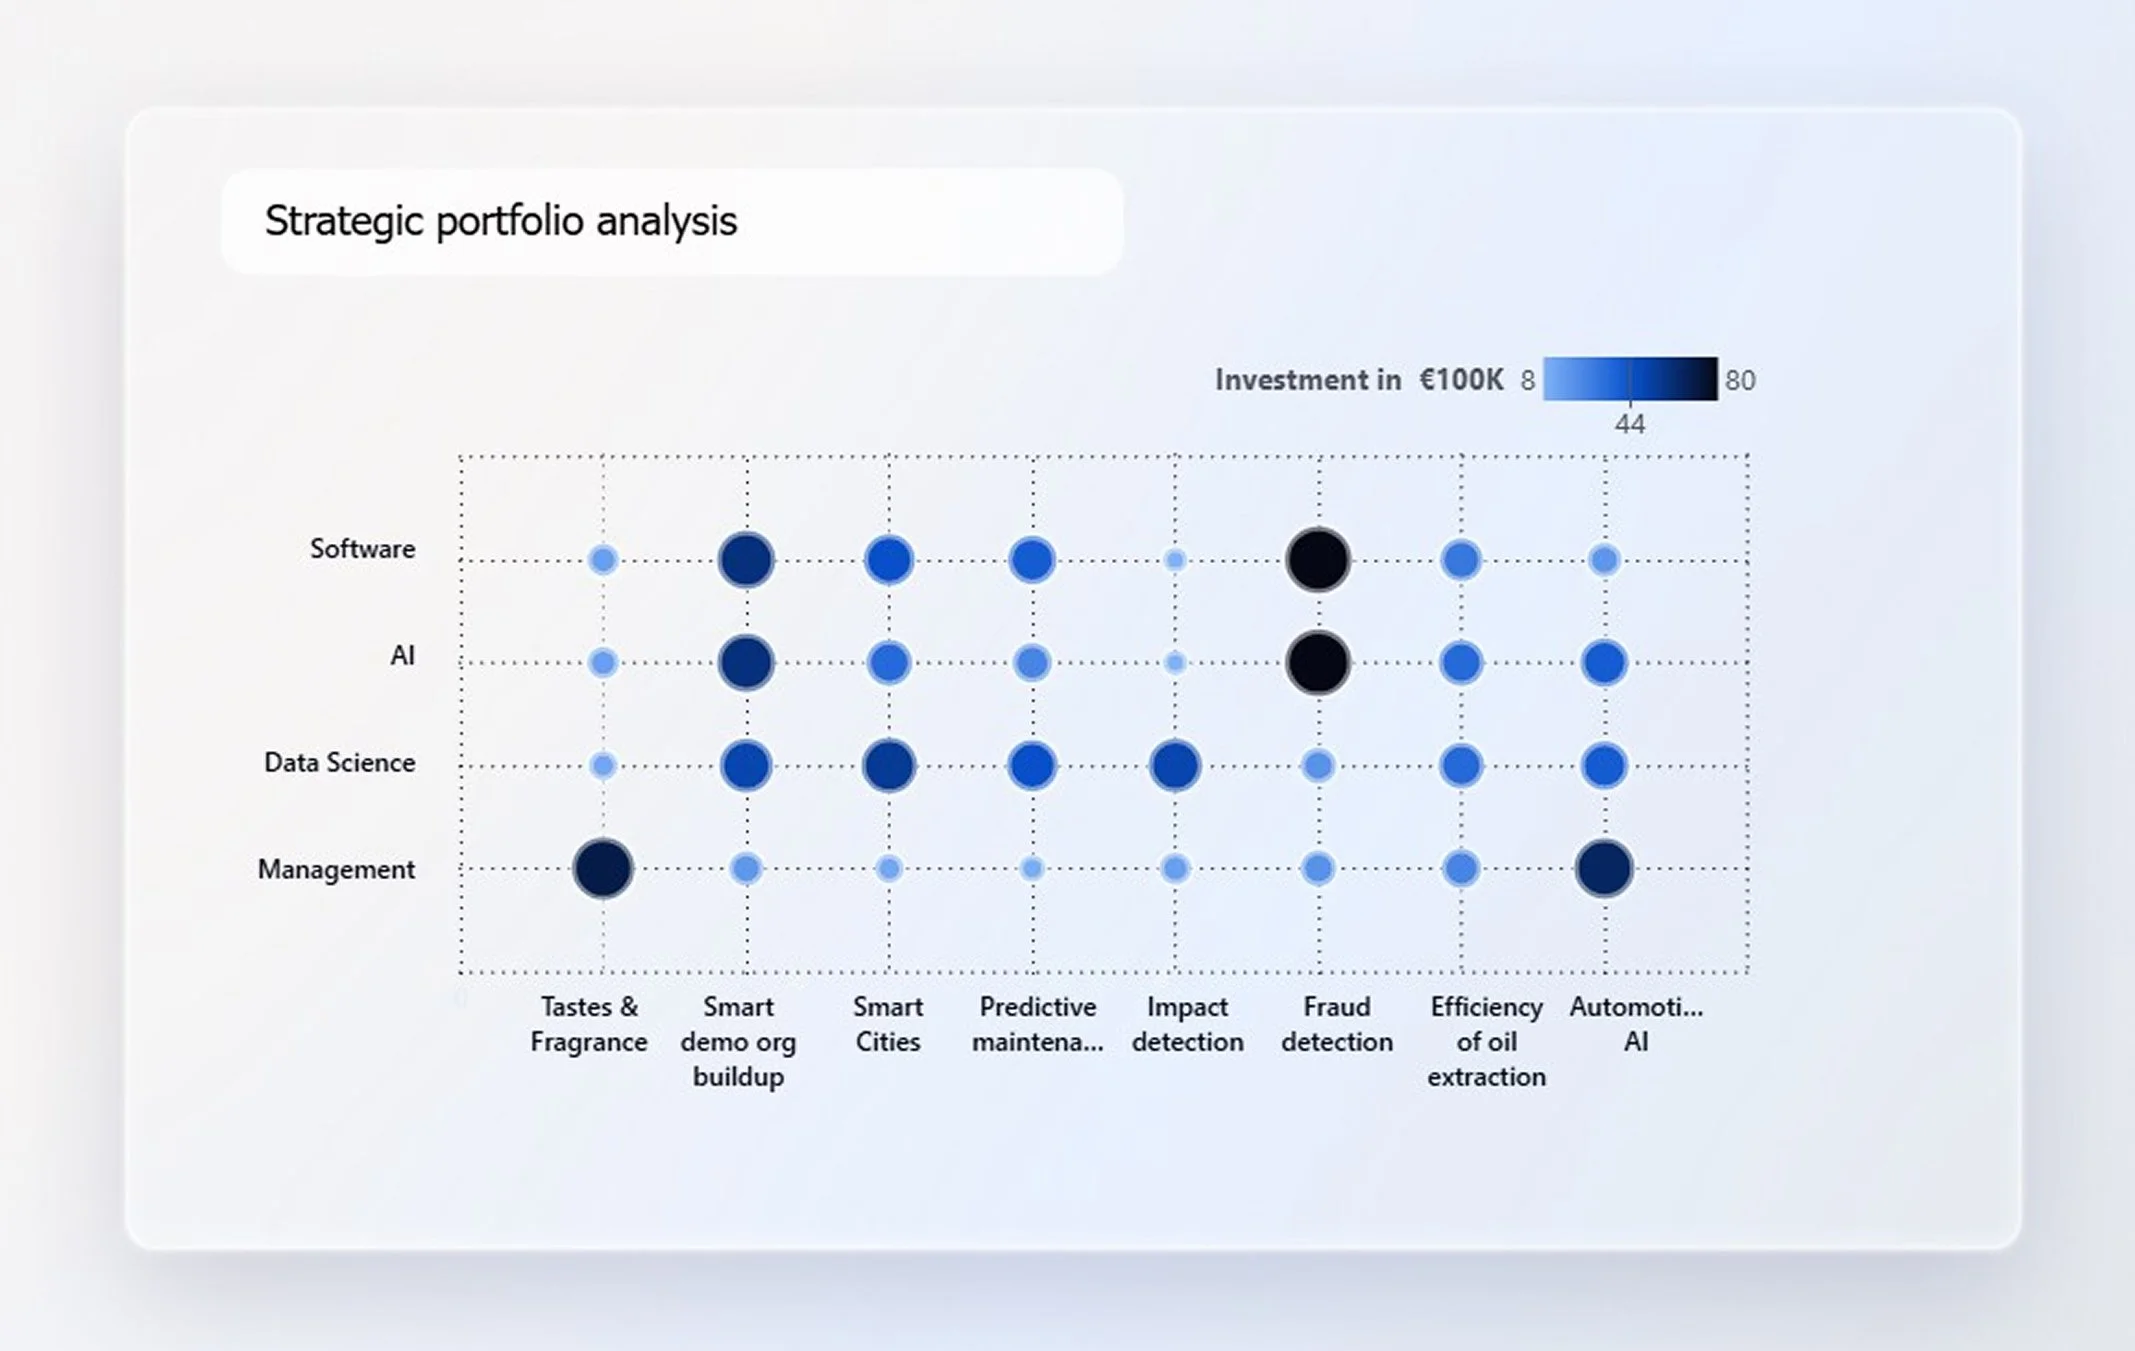
Tutorial 7: Scatter plot
Show the correlation between two categorical variables.
Tutorial 8: Variance Chart
Show the deviation from a target with visual calculations.